Water Quality
Temperature and Dissolved Oxygen
 Temperature and Dissolved Oxygen (DO) profiles give us important information about the lake. After the ice leaves in the spring the water is fairly uniform in temperature and density, allowing the lake to mix completely. This spring "turnover" recharges the bottom water with oxygen and brings nutrients to the surface. As summer approaches and the water surface warms it becomes less dense and "floats" on the colder layer underneath. Between the two layers is a region called the thermocline, where the temperature changes rapidly. This "layering" phenomenon, known as thermal stratification, inhibits mixing. The steep “slope” represents the thermocline region, where the warm and cold layers meet. Note that in spring and fall - when the lake is “mixed”- there is no thermocline.
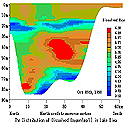
During stratification the oxygen in the bottom layer gets depleted due to decay of material in the bottom sediments. This decay releases nutrients into the water. Stratification traps these nutrients and enriches the bottom layer of water. Fish kills may result if DO levels fall too low.
The Dissolved Oxygen on Bottom Chart represents the dissolved oxygen concentration at the lake bottom. Fish kills may result if DO levels fall below 5 milligrams per liter. During the summer months Lake Singletary commonly experiences DO under this threshold at depths below 5 meters.
As the weather cools again in the fall, the density of the surface layer increases, and it gradually sinks towards the bottom, allowing mixing. During the fall "turnover", the nutrient-rich bottom layer mixes with the top layer, often resulting in a fall algae bloom.
DO and temperatures are measured using a digital electronic meter with a probe suspended on a calibrated line. As the probe is lowered the DO and temperature are measured at various depths from the surface to the bottom. The resulting DO and temperature profiles provide information about stratification.
On the Temperature profile chart below a near-vertical line signifies uniform temperature. The thermocline is the "plateau" region of the graph. You can see that as summer progresses the thermocline moves deeper and gets more pronounced. As fall approaches the water mixes and temperature becomes more uniform again.
The Dissolved Oxygen profile chart demonstrates how DO concentration behaves. In spring and late fall, DO concentration is uniform, signified by a near-vertical line. Note the plateau areas. As summer progresses, DO drops from about 8 mg/L to 2 mg/L or less in the thermocline region, usually between 4 and 8 meters. In summer, DO at the bottom of Lake Singletary drops well below 5 mg/L, the level considered safe for fish.
More on Water Quality...
Graphs and Charts
Historical Trends

Historical Data